Monday Night Paint-Splashing

Ice Shelf, watercolor                                                                &nbs…

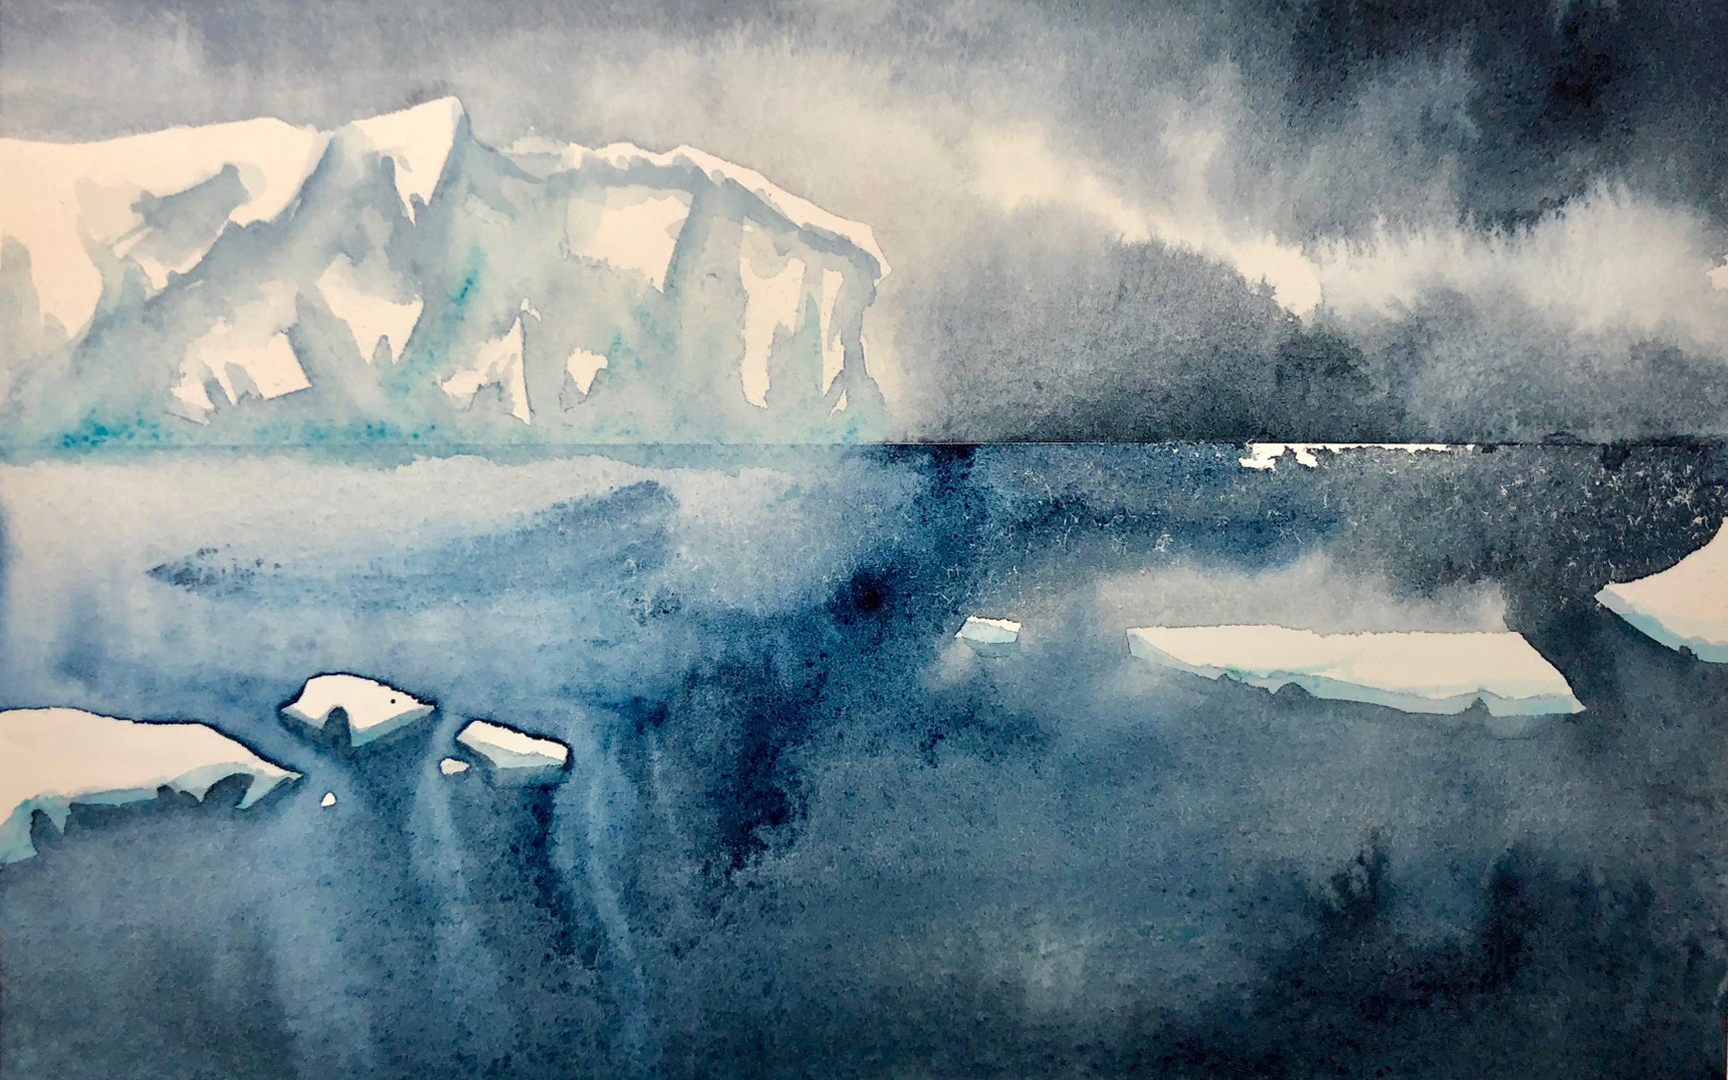
Ice Shelf, watercolor                                                                      Copyright © Marlo Garnsworthy

I love Monday nights.

Monday night is creation night. It’s hastily-shoveled-in-leftovers-in-the-studio night or earbuds-in-laptop-on-local-pub night. This week, it’s also the first night of Polar Week! 

Kev and I have been furiously preparing to launch Pixel Movers & Makers and working on our first animation about Antarctica's Pine Island Glacier. 

But for the last couple of months, I’ve also been working feverishly on something I’ve called the Sea Ice Sketch Project. I’ve been painting watercolor (or watercolour, depending on where you are) sketches of sea ice… and ice shelves and polar ice in general. (Some of the pieces have become banners for our website.)

My passion for polar ice began, it’s true, with sea ice. But it’s spread quicker than katabatic winds can steal your gloves to all polar ice. And so now, I’ve renamed it the Polar Ice Sketch Project. (Let it be duly noted that one of my brilliant friends suggested I call it the Icy Poles project, but I wasn’t sure anyone but fellow Aussies would get the reference.)

I’ve been trying to film my painting process. My first effort was going well until disaster struck…

Not enough painter's tape on my desk lamp. But I'm working it out.

Here, I put the finishing touches on the ice shelf in the painting at the top of this post. 

I'll be using similar techinues — and some others — as we continue our first animation project. I look forward to sharing!

I always paint to music. Here's what was on my Spotify during the above video (and which YouTube made me record over, alas): Youme & Meyou by Einstürzende Neubauten.  

Sunday afternoon coding

This weekend, I made a quick sketch of an animation using global temperature anomaly data. My goal is to graph the proportion of areas of the earth that were cooler and warmer than average over time.

After a quick search, I found the data I was looking for on NOAA's website. It is basically a large text file with the average monthly temperature for every 5° by 5° section of the globe.

It was the most beautiful text file of data I have ever seen:

ncdc-trimmed_10fps_480x256.gif

Each line contains 72 temperature values for each of the 5° sections; there are 32 rows, one for each 5°s of latitude. Between each section is the month and year. -9999 is used to signal no data available. The temperatures are in degrees Celsius converted to integers (the counting numbers: 1, 2, 3, etc.) by multiplying by 100 — presumably to avoid those pesky decimal points. 

So, what now?

Well, for quick sketch animations, I use processing.org, which is a java-based animation framework, which means I get to play with all the java data structures! So, I gotta read all that lovely data into some of them. But what and how?

Ok, I figure I'll be rendering the temperatures onto a map of somesort, which means I'll need to read the data so I can get all the months' temperatures all at once. Basically, given a year and month, I need the temperatures.

Uh oh! I'm going to start to get a tad techie below, if that floats your boat then please continue, if you're a keen learner then I'll assume you've had a go at processing's excellent tutorials otherwise you can skip to the end to see the pretty teaser animation!

Well, the temperatures are in a two-dimensional grid. So, that pretty much calls for a two-dimensional array, which is a way of storing stuff in memory, just like a grid.

int[][] temperature;

The square brackets there indicate, in a cack-handed kind of way, that temperature has two dimensions. So far so good.

But I'm going to need 1,656 of them! One for each month of each year between 1880 and 2017. So, why not add a third dimension? Indeed, I could and just number the months 0 - 1,655, and it'd work just fine. But that's not very interesting. I need a challenge — I mean, it's Sunday afternoon coding for goodness sake!

What I chose to use was a HashMap for no other reason than I get to use generics! A hash map is a data structure that behaves kinda like an array, but the index can be anything you like and it doesn't need to be sequential. (In this case, I can actually just use integers, and they'd be sequential — I'm a sucker for punishment.)

I defined the HashMap like so:

HashMap<String, int[][]> data;

Much more interesting than a dull old multidimensional array! So what's going on here? What's with the angle brackets?

This type of data structure is known as a generic. Which means it can use any type of data; strings (basically, sequences of characters, AKA words and sentences), integers, objects (computery type objects, not those things on your table over there), etc. In this case I'm using a String and a two-dimensional array of integers, which I've listed inside the angle brackets. The first item is what is known as the "key" and the second is the "value."

I figured I could make the key something like "{month} {year}" eg: "7 1956" for July 1956, which would return the temperature grid for that month and year like so:

int[][] temperatureGrid = data.get("7 1956");

So, how do you get the data in there?

Well, first I can't really use the pretty data file, as it is much easier to have a single character to separate the data values, such as a tab. As you can see here in this close up there are multiple space characters between the values (the little grey dots).

A close up of the temperature data showing the multiple space characters delimiting the values.

A close up of the temperature data showing the multiple space characters delimiting the values.

So, open up your favourite text editor *cough* Visual Studio Code *cough* and replace all the multiple spaces with a single tab. I did this by using what are called regular expressions, basically wildcards on steroids. Good text editors will have this as an option in find dialogs.

Visual Studio Code's find dialog showing the regular expression option highlighted in blue.

Visual Studio Code's find dialog showing the regular expression option highlighted in blue.

In the above image I set the pattern to find as \s+. The \s means match any space character and the + means find at least one of the previous pattern. So this will match one, two, or twenty space characters. (You can literally type the space character followed by the + but this looks dumb in a blog post as it looks like I'm talking about nothing).

In the replace box the \t represents the tab character. This will replace all the spaces matched by \s+ with a single tab.

I saved the data in a file called ncdc-merged-sfc-mntp-tab-delimited.dat to the same folder as my Processing sketch where I can easily load the file into one large string array called lines:

String[] lines = loadStrings("ncdc-merged-sfc-mntp-tab-delimited.dat");

The string array lines now contains all the data from the dat file. I just need to loop through each line and split it into useful stuff.

for (String line : lines) 
{    
  String[] values = split(line, '\t');
}

This is called a "for loop", it's read like so: for each of the string line in the string array lines execute the code inside the curly brackets.

The variable line ends up with a single line from the data file which we had previously modified to have single tab (\t) between each value. The command split(line, '\t') uses those tabs to create an array of strings which are the temperature values we want.

You can now see why I went to the trouble of removing the multiple spaces. If I hadn't and split on the spaces above, I'd get many empty values and that wouldn't be nice. But now I just split on a single tab and get the right amount of values.

So, the idea is that I loop through the file, scoop up the temperature data, and anytime I come across a line with the month and year in it, store the temperature data away in the HashMap keyed on the date. Simple.

What follows is the complete code to load the data; this is called via

loadData();

in the setUp method in the processing sketch.

HashMap<String, int[][]> data = new HashMap<String, int[][]>();

void loadData()
{
  String[] lines = loadStrings("ncdc-merged-sfc-mntp-tab-delimited.dat");
  String theKey = "ignore";
  int latCount = 0;
  int[][] tempGrid = new int[37][73];
  for (String line : lines) 
  {    
    String[] values = split(line, '\t');
    if(values.length == 2)  // This detects the line with only the month and year
    {
      data.put(theKey, tempGrid);
      tempGrid = new int[37][73];
      theKey = values[0] + " " + values[1];
      latCount = 0;
      continue;
    }
    
    for(int lngCount = 1; lngCount <= 72; lngCount++)
    {
      tempGrid[latCount][lngCount - 1] = int(values[lngCount]);
    }
    latCount++;
  }
  
}

Be sure to come back next week, when I'll start actually using this data and do some pretty stuff like so:

out.gif

It also involves maths and Kavrayskiy VII projections, mmm good!

Pixel Movers & Makers Launch!


Hey, it’s Marlo and Kev here!

We’re quite excited to launch Pixel Movers & Makers in time for International Polar Week! We’ve been hard at work for a few months now, making pixels, moving pixels, and crafting this new grand adventure.

In February, Marlo attended the APECS workshop on Antarctic Hydrology and Ice Shelf Stability at Lamont-Doherty Earth Observatory, where we were thrilled to present a poster about effective polar science communication and our first sample animation — and equally pleased by the response our efforts received.

APECS POSTER sm.jpg

We look forward to sharing our process and journey to creating informational videos about our changing planet that entertain, inspire, and compel.

Follow us on Twitter:

Pixel Movers & Makers --- @PixelMnM

Kev, Pixel Mover --- @KevPluck

Marlo, Pixel Maker --- @MarloWordyBird

                                                                                                                ~ Marlo & Kev